

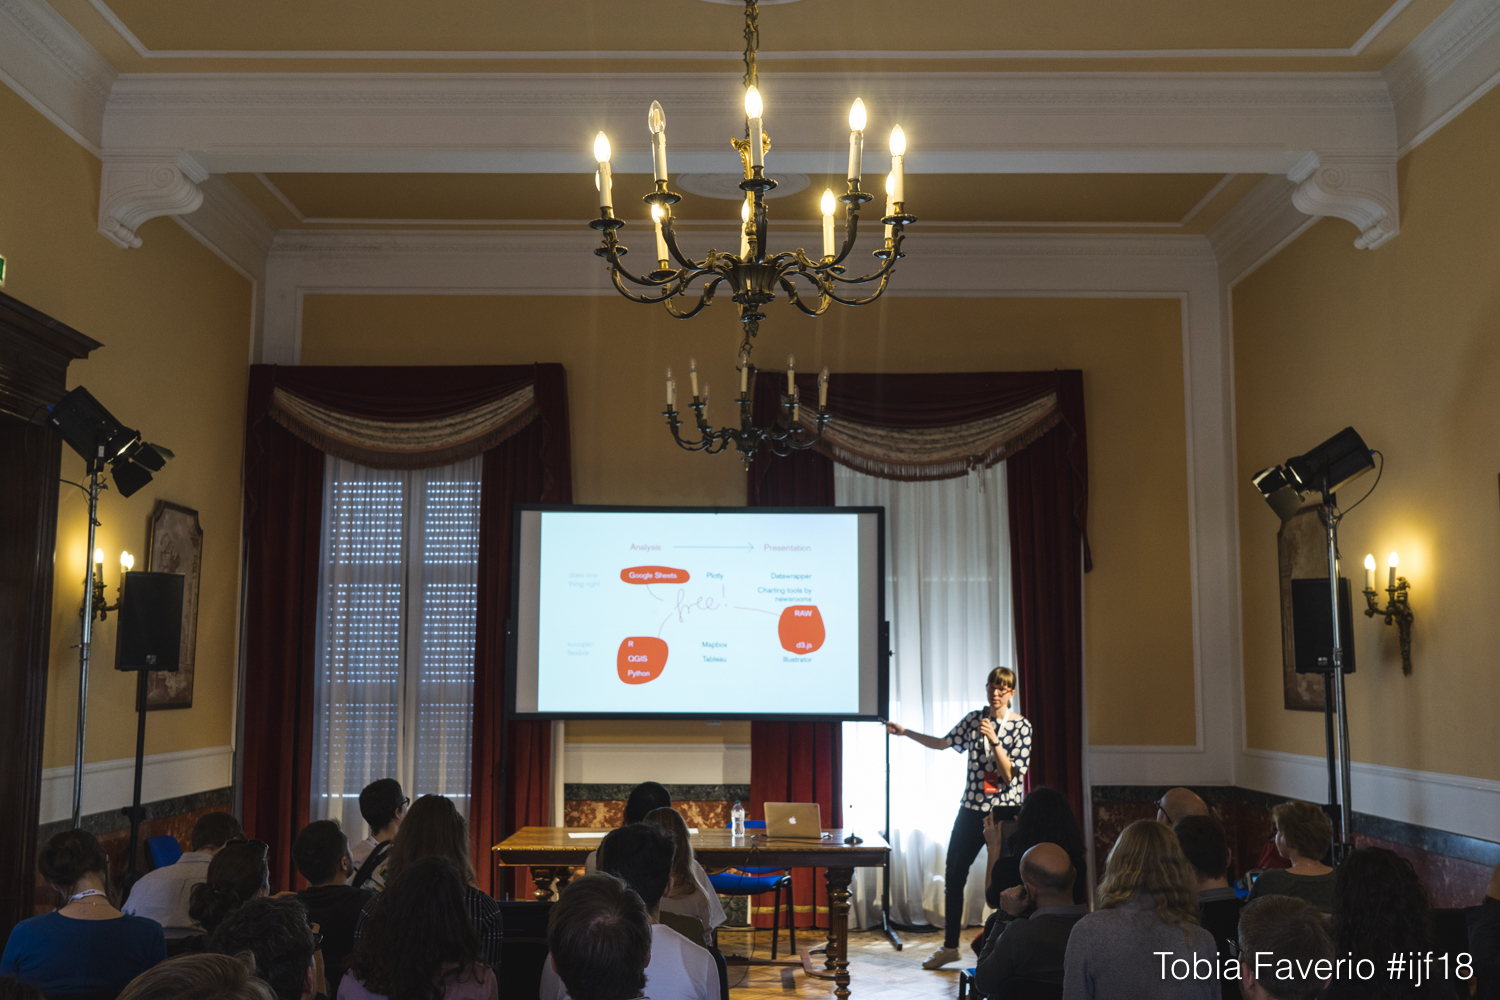
What are the tools that experts use to create highly interactive and customised graphics? And what are the tools that you can use to quickly create a bar chart or map? Then I'll show you how you can create charts and maps that won't make your graphics department cringe with the tool Datawrapper – from spreadsheet data to the embedded graphic. You'll learn some do's and don'ts as well as best practice. The goal of the session is to give you the tools to create data viz yourself, and to increase your understanding of what your graphics department is talking about. Bring your laptop and let's start charting!

data journalism
| in English (without translation)
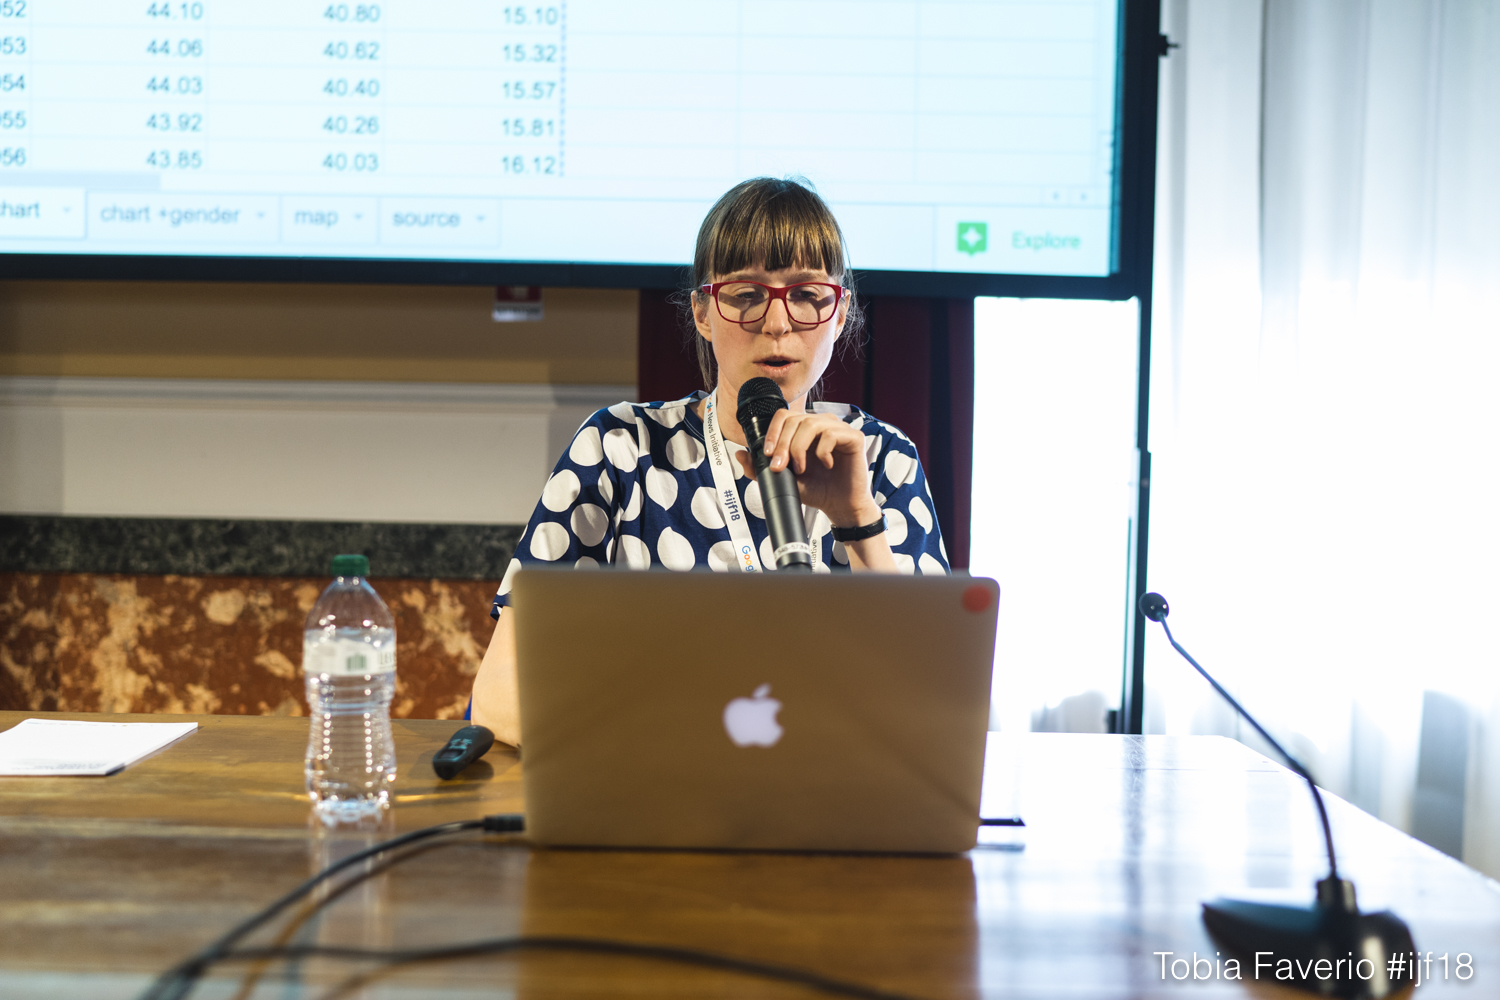
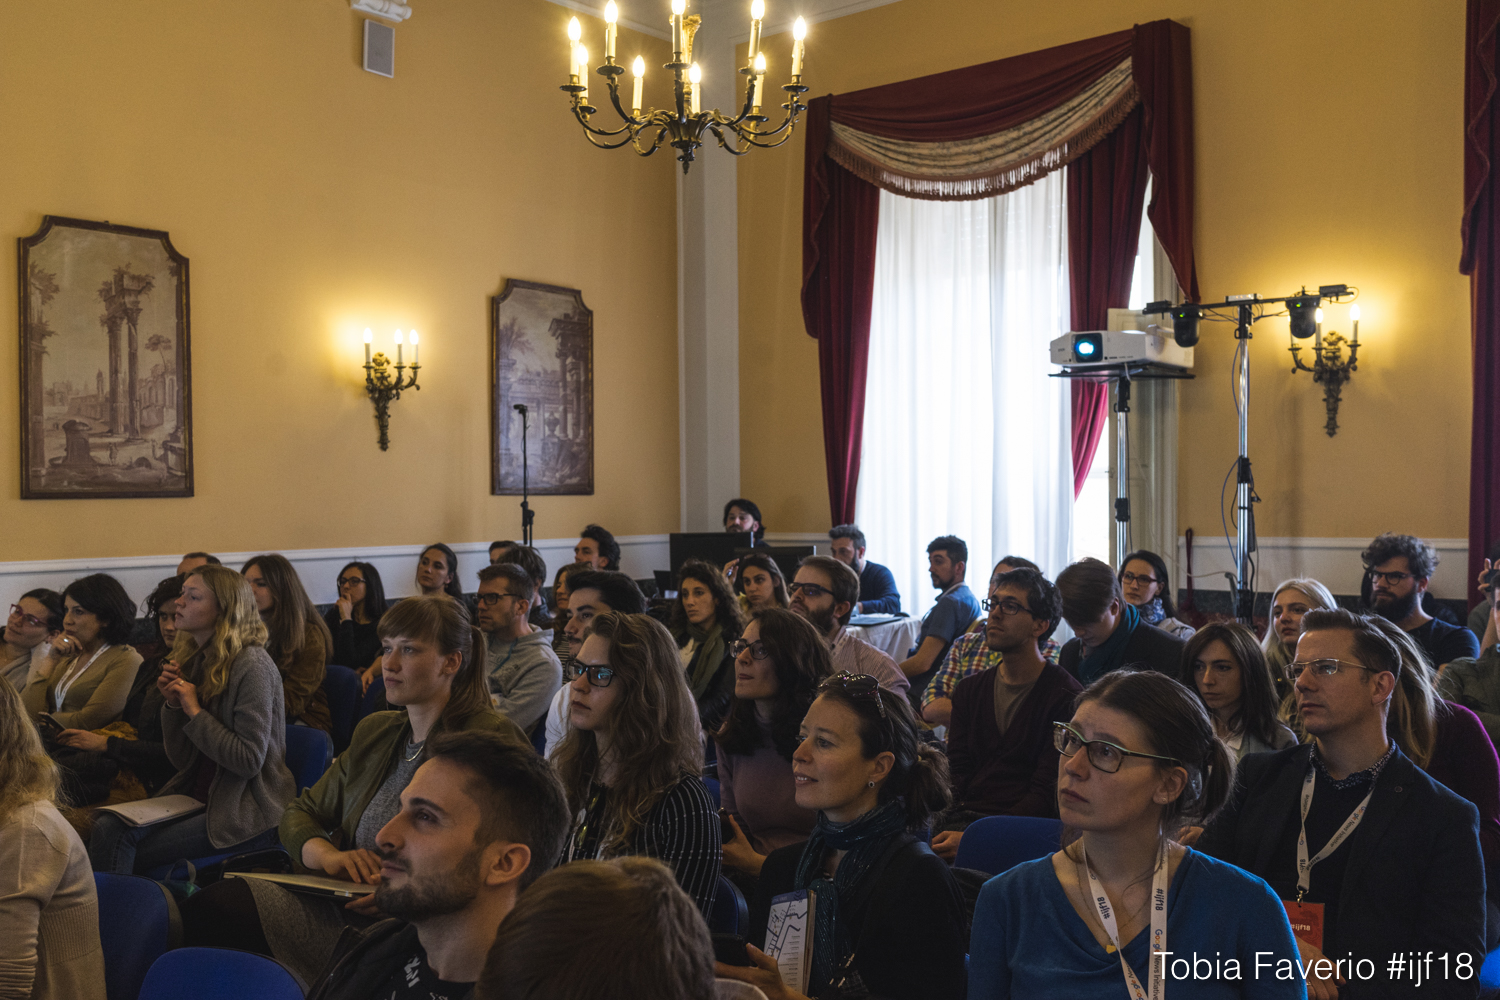
The basics of data visualisations for newsrooms
Warning: Trying to access array offset on null in /var/www/media.journalismfestival.com/httpdocs/wp-content/themes/vlog/eventDetails.php on line 131
Warning: Trying to access array offset on null in /var/www/media.journalismfestival.com/httpdocs/wp-content/themes/vlog/eventDetails.php on line 137
Photos


This work is licensed under a Creative Commons Attribution-NoDerivatives 4.0 International License (CC BY-ND 4.0).
Warning: Trying to access array offset on null in /var/www/media.journalismfestival.com/httpdocs/wp-content/themes/vlog/eventDetails.php on line 177
Warning: Undefined variable $cnt in /var/www/media.journalismfestival.com/httpdocs/wp-content/themes/vlog/eventDetails.php on line 200
Lisa Rost
Datawrapper
Warning: Trying to access array offset on null in /var/www/media.journalismfestival.com/httpdocs/wp-content/themes/vlog/eventDetails.php on line 209
Warning: Trying to access array offset on null in /var/www/media.journalismfestival.com/httpdocs/wp-content/themes/vlog/eventDetails.php on line 213